How Can We Help?
Readership Activity MapReadership Activity Map
Introduction
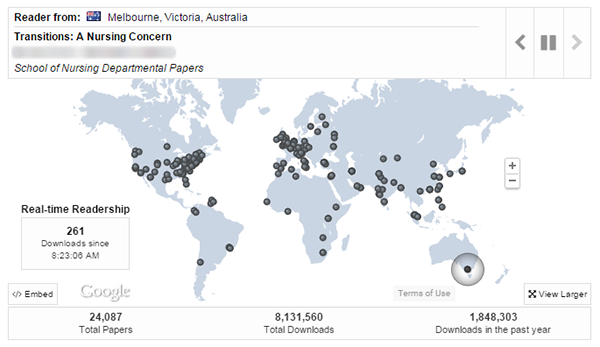
The Digital Commons Readership Activity Map is a real-time visualization of downloads across the globe. Available for the repository homepage or any collection, the map can be enabled wherever you wish to demonstrate the value and reach of your content—from a particular journal to all of a department’s publications. Contributions to the repository may also be showcased elsewhere using an embeddable map for inclusion on department, center, or other affiliated sites.
Location pins appear on the map to highlight the impact of repository scholarship as works are downloaded. To ensure a lively display for any collection size, maps can be adjusted to show recent download activity or live activity, and their colors and placement are configurable as well.
Map Features
When a visitor downloads an article from a Digital Commons collection, a highlighted pin drops on the readership map at the approximate location of the download. The article’s title, author, and publication (e.g., “Oceanography Center Publications”) appear in an automatic feed on the title card, along with location information.
Before any pins drop, an identification card briefly shows the name and location of your institution and basic information about the purpose of the map. The bottom of the map displays statistics from the repository or collection where the map is enabled. The map resets when visitors leave or refresh the page.

Control Key:
- Pause Button: Lets pins continue to drop, but stops the feed from updating.
- Forward and Back Arrows: Allows visitors to browse the feed’s history until the visitor presses the triangular “play” button to resume real-time activity, or uses the forward arrow to advance back to the present.
- Drag Function: Lets visitors use the hand tool to move the map up, down, and sideways, and the map will stay in the chosen position until the page is refreshed.
- Plus and Minus Buttons: Allows visitors to zoom in and out. The map limits how far users can zoom in to preserve readers’ anonymity.
- View Larger: Allows visitors to see a larger version of the map on a dedicated page (readership_map.html) that removes the sidebar to make additional room for the map.
- Embed: Leads to a page for configuring the map to display on an external site, such as a departmental website. For details, see the final section of this document.
Adjust Map Placement and Display
The Digital Commons Readership Activity Map can be included on a repository homepage or on the main page of a community or publication (series, journal, etc.). Configurations are available to administrators at each level to enable the map and control its appearance.

Basic Map Settings and Placement Options
The Readership Activity Map may be added to the homepage of the repository, or any publication or community, by selecting the map’s position in the configurations. To enable a map:
- Visit the Configuration tab at the site level or the collection where you wish to enable a map. If you are logged in, you may also click Configuration from the Administrator Toolbar when viewing the desired context from the front end.
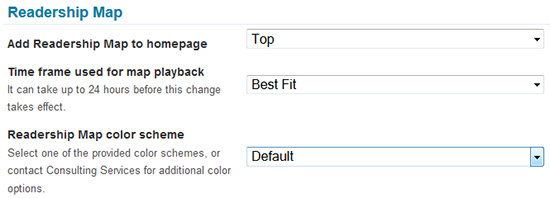
- In the Readership Map section of the Configuration screen, select a placement option from the Add Readership Map to homepage setting.
- Off: Choosing this setting will disable the map if previously enabled for the site or collection. To disable a large number of maps, please contact Consulting Services.
- Top: Map appears above the “Browse Research and Scholarship” section on the repository homepage. In communities and publications, it appears below the main publication title and above any introductory text.
- Middle: Below the introductory text. At the publication level, between any introductory text and the content list.
- Bottom: Bottom of the homepage above the footer.
- Click the Submit Changes button, then click the Update link in the sidebar. To change the color from the default provided, see “Color Options” below.
At any time, you may preview layout configuration changes before making them live by clicking Submit Changes, then the Preview link in the sidebar. Please note the map only appears on the first page of publications with multiple pages of content.
Color Options
Several color schemes are provided to coordinate the Readership Activity Map with a variety of designs. You may select a color scheme following the steps below or, to display a basic topographical map, leave the Default option in place. In publications and communities, the Default option will inherit the color options selected at the site level. To modify the color of the map:
- On the Configuration screen, select one of the available color schemes from the Readership Map color scheme drop-down menu.
- You may view the color you have selected by previewing the page. To preview, click the Submit Changes button, then the Preview link in the Configuration left-hand sidebar.
- Once you are ready to display the map with the selected option, click the Update link in the sidebar.
If you would like to request a specific map color not included in the predefined color schemes, please contact Consulting Services.
Institution Name and Location (site level only)
At the repository level, additional settings appear on the Configuration screen for identifying an institution and its location. This information will display on the map’s placeholder card before pins start to drop.
- Institution city: Spell out the full city name.
- Institution state or region: Spell out the state or region.
- Institution country: Spell out the country.
- Institution country code: Enter the two-letter ISO country code in lowercase to show the country’s flag. Example: “us” is the code for the United States. See Wikipedia for a full list.
Select Playback Options to Match Different Activity Levels
The playback rate of the Readership Activity Map can be adjusted to accommodate different levels of download activity. Pin drop behavior is controlled by the Time frame used for map playback setting on the Configuration screen.
- Best Fit: Recommended. Automates map playback to use the most appropriate option out of Live, Hour, Day, Week, or 30 Days, based on average downloads over the past month. In collections with fewer than 40 downloads in the preceding month, the map won’t display until traffic increases beyond that threshold.
- The Best Fit option will adjust as a collection grows. A new site’s map might initially play back downloads from the past 30 days. As popularity grows, the map would automatically adjust to show downloads from the previous week, day, or hour, and eventually switch to a live display when the download rate is high enough to support it.
- Live: Displays downloads as they occur in real time. The Live option is most suitable for repositories or collections with consistent traffic and over 4,000 published objects. However, this option is free to use wherever visualization of live downloads is desired. When using the Live option, the download count caption will read “Real-time Readership.”
- Hour, Day, Week, 30 Days: For smaller collections, plays back recent “historical” downloads from the past hour, day, week, or 30 days. Maps configured to show historical downloads will switch to live data once all downloads from the chosen time frame have displayed.
To modify the playback for a map:
- Navigate to the Configuration tab of the site or collection where the map will display.
- Select the desired value from the Time frame used for map playback list.
- Click the Update link in the Configuration sidebar. Playback changes can take up to 24 hours to take effect.
Download count captions will state “Recent Downloads” instead of “Real-time Readership” when displaying any of the time frames besides Live.
Embed a Readership Map on an External Site
An embeddable Readership Activity Map is available to showcase the impact of a collection’s scholarship on an external site, such as the homepage of the library or research office, or a particular department or school.
Before embedding a Readership Activity Map, it will need to be enabled and displaying in the repository. If you wish to embed a Readership Activity Map without enabling it in the repository, please contact Consulting Services for assistance.
To generate the embed code for a map:
- Click the Embed link in the lower, left-hand corner of the Readership Activity Map you would like to embed.
- Follow instructions on the resulting page to generate the embed code. After you select a desired map size, two code snippets will appear in the windows below, ready for inclusion in your external HTML file. The only code modification required is to replace the “origin” placeholder URL “http://your_site_here.com” with the URL of the site where the map will be embedded.
- Using the code generated, the embedded map will have default settings for refresh rate, color, and institution. These may be modified directly in the code or by contacting Consulting Services for assistance.
 Digital Commons Help Center