How Can We Help?
Author Dashboard: Real-Time Usage Statistics for AuthorsAuthor Dashboard: Real-Time Usage Statistics for Authors
The Author Dashboard is a personalized metrics and reporting tool for authors with works published in Digital Commons. As an author, you can easily access your dashboard to view current download statistics for every work you publish, as well as global insights into the sources of readership.
Use the Dashboard to quickly pull up information for a body of work or for individual articles. Explore recent data, all-time statistics, or a custom date range. You also have options to share and export the data.
If you are an author looking for information about submitting works to a Digital Commons site, please see Author Submission Steps in Digital Commons.
Access the Author Dashboard
To access your Author Dashboard, visit https://readership.works.bepress.com/. Enter the email address and password associated with your account if prompted to log in.
Other ways to reach your Dashboard:
- On your My Account page, click Author Dashboard in the Dashboard Tools section.
- Use the dashboard link in your monthly readership report email.
Navigate and Filter the Dashboard
The Author Dashboard has four tabs that you can reach using the options on the left (on mobile, use the left-facing arrow to expand the tab list).

Dashboard tabs summary
Each tab is explained in more detail in the sections below. Here is a summary of what they provide:
| Readership: The default screen when accessing the author dashboard. Offers a comprehensive picture of where and how users are accessing content geographically, by institution, and over time. | |
| Usage Reports: Allows you to view and generate reports for downloads, metadata page hits, works posted, or individual works. | |
| PlumX Metrics: Shows the full impact of your work with a variety of article-level insights and alternative metrics. | |
| Share the Dashboard: Provides access to saved dashboards and share links; these make it easy to demonstrate impact to others with no login required, and they also track the number of views. |
Modify the date range on the Dashboard
You can select a specific date range for the dashboard using the date picker. Readership widgets and reports adjust to reflect the dates shown.
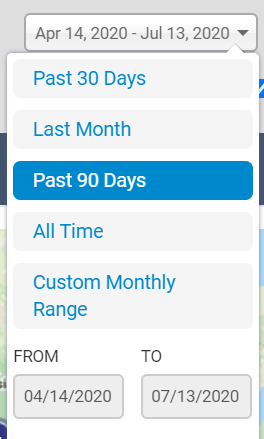
Time frames available:
- Past 30 Days: A 30-day snapshot including today’s date.
- Last Month: The previous calendar month, which correlates to the monthly readership email report.
- Past 90 Days: The maximum amount of time for which daily results are available.
- All Time: Monthly data going back as far as readership data exists for your works.
- Custom Monthly Range: Allows you to select a custom range of available dates containing data for your works. The date range is inclusive, so to run a report on a single month, select the same month for the start date and end date.
Note: The dates on the PlumX tab are not affected by the date range menu and will remain all-time.
Filter the dashboard for individual works
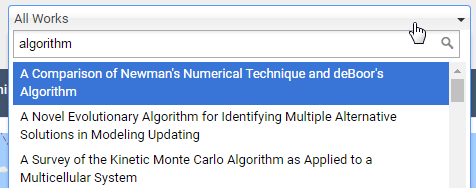
You can view statistics for a specific work using the “All Works” drop-down list. Click and browse, or you may type in the search box to narrow results. When you select an individual work, the filter will adjust information in the widgets to only show data for that work.
Explore Sources of Readership
Click the world icon to access the Readership tab, which includes unique views on your work's readership, including: a Readership Map, Institutions, Country/Regions, and Referrers.

Readership map
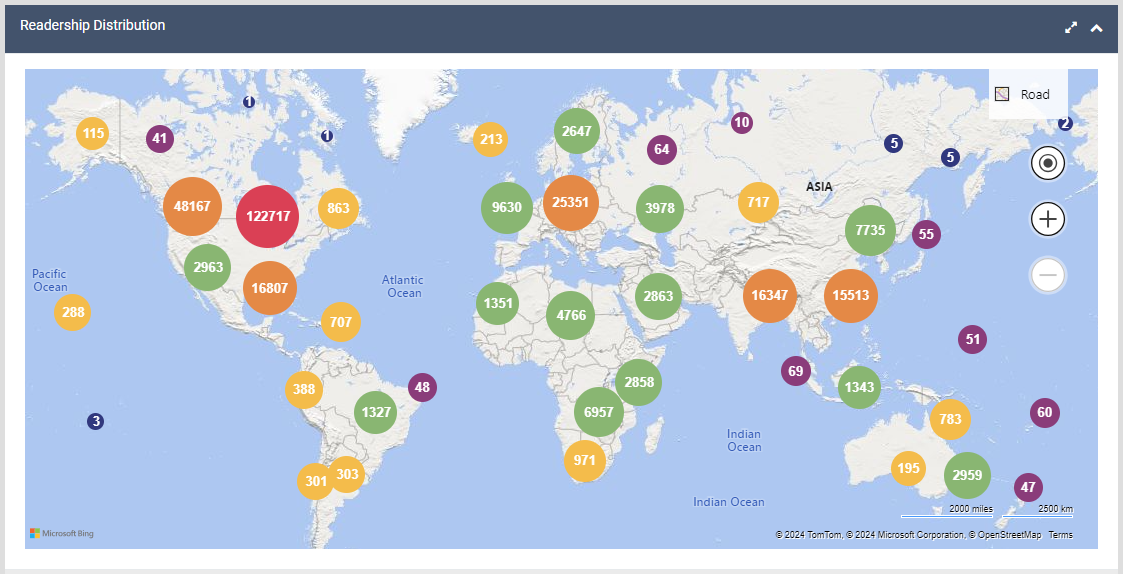
The readership distribution map displays download counts by location for the date range selected. If the dashboard is filtered for an individual work, the map will update to show download data for that title. Click the download clusters to zoom in to a more granular view and to see details of downloaded works.
Map controls:
- Click the
 view larger icon to expand the size of the map, which can be useful on a mobile device.
 - Use the +/- buttons to adjust the zoom level and get a more detailed view of download locations.
- Move the map by dragging it.
Cluster marker colors and what they represent:
Cluster colors indicate the number of digits in a region’s download totals.
- Pink: Hundreds of thousands of downloads
- Orange: Tens of thousands of downloads
- Green: Thousands of downloads
- Yellow: Triple digits
- Purple: Double digits
- Purple: Single digits
Drilling down to readership details:
Click the cluster markers to zoom in and reveal more detailed clusters. Clicking the lowest-level marker will display readership details, including the titles of downloaded works and the institution(s) where they were accessed, if applicable. Results can be sorted using the arrows at the top of each column.

Institutions
The Institutions widget displays organizations, universities, and other settings where full texts were downloaded, along with the number of downloads at each. Institutions have been identified by their IP address. The time period reflects the current date selection for the dashboard.
View downloads per institution type using the color-coded graph:

- Click an institution type or color block to filter the list by type, or select from the Filter by type menu.
- The institution types are: Commercial, Organization, Government, Military, Education, and Library.
- To return to viewing all institution types, select “Show All” from the menu.
Explore readership details by institution in the table:
- Start typing in the table’s search box to find a particular institution or institution type.
- You can show more than 10 entries in the table by selecting a different number from the “Show ___ Entries” drop-down list.
- Results can be sorted using the arrows at the top of each column.
- Use the arrow to the left of an institution to view individual article downloads.

Search and export institutions:
The search box in the table may be used to further refine institution results. Clicking Export will allow you to output whatever is currently showing in the widget to CSV. If no search has been performed, all entries in the widget will export. Whether exporting a full list or a filtered list, only top-level institution data will be included, exclusive of any article-level details available by manually drilling down.
Suggesting a different institution category:
If you see an institution in an incorrect category, tell us about it! Click the edit icon ![]() next to the institution type for an expanded institution and complete the form.
next to the institution type for an expanded institution and complete the form.
Country/Region
This table shows top downloads by country, which are easily broken down by region or state using the interactive map. Countries have been identified by IP address.
Click a country on the map to see a regional distribution of that country’s readership and to populate the table with the regions displayed. Hovering over a region on the map provides a quick view of the associated downloads.
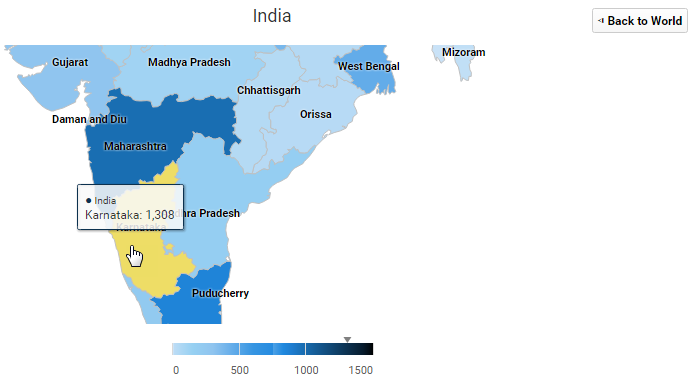
To return to the world map, click the “Back to World” button.
Explore readership details by country in the table:
- You may start typing in the search box at the top of the table to find locations.
- You can show more than 10 entries by selecting a different number from the “Show ___ Entries” drop-down list.
- Results can be sorted by using the arrows at the top of each column.
- Clicking the arrow to the left of each entry drills down to article details for the selected country.

Export Country/Region data:
Clicking Export will allow you to output whatever is currently showing in the widget to CSV. If no search has been performed, all entries in the widget will export. Whether exporting a full list or a filtered list, only the country-related data will be included–exclusive of any article-level details available by manually drilling down.
Referrers
The sites listed here reveal the sources of inbound traffic to full-text documents. Use the search box to find specific referrers and export current results to a CSV file.
You can show more than 10 entries by selecting a different number from the “Show ___ Entries” drop-down list. Sort the list by using the arrows at the top of each column.
Note that some valid downloads do not have associated referral data, because not all users pass along referral information. Over the years, fewer and fewer browsers and search engines have passed along this information, so referrer numbers now include only a small fraction of traffic.
View Usage Reports and Statistics
Click the graph icon to access the Usage Reports tab, which offers statistics in the following sections: Downloads, Metadata Page Hits, and Works.

Downloads
This section shows the number of downloads for all of your works, within the time frame currently selected for the dashboard. Click the Include additional files box if you wish to count supplemental files such as datasets, book chapters, or presentation materials. Additional file downloads will display in red at the top of graph bars.
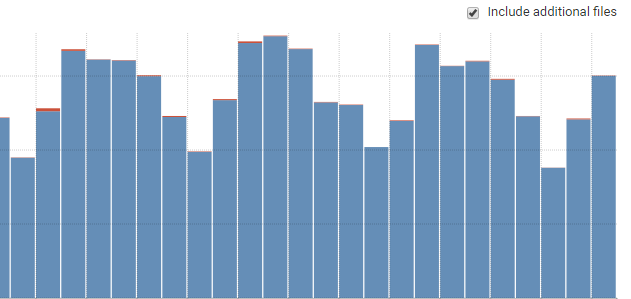
Hovering over a bar on the graph displays the corresponding number of downloads and the date when those downloads occurred.
Note: If you have had any withdrawn articles, the individual article download counts listed in the Works table may not add up to the total download number shown here. This is because the withdrawn articles themselves are not included in the Author Dashboard, but any downloads for withdrawn articles are counted in your total number of downloads.
Metadata page hits
This graph shows traffic to article metadata pages (aka, item information pages) during the active time frame.
Downloads tend to be higher than metadata page hits, since users frequently access full texts directly via search engines. Metadata page hits can offer insights into how readers browse and search to find content, type a URL from a citation, or click metadata page links in search results.
Works
The Works table at the bottom of the dashboard shows a list of all published works, similar to the individual works drop-down list at the top of the page. Clicking the title of a work focuses the dashboard widgets to show readership data for that submission only.
The table shows all published works whether or not they have been downloaded. Any works in the table with zero downloads will appear with “n/a” in the downloads column.
Click the external link icon ![]() to the left of each title to visit that work’s article information page in Digital Commons.
to the left of each title to visit that work’s article information page in Digital Commons.
To export all works:
If you wish to export download data for all of your works available in the Author Dashboard, use the Export button in the Works table. All works will be included in the export as long as a search hasn’t been performed to filter the results.
You may also use the search box to filter results for individual works or subsets of works, and exporting will restrict output to those results.
PlumX Metrics
The PlumX tab provides citations and altmetrics for measuring the broader impact of your work. Click the PlumX icon to access this tab.

With access to diverse metrics, such as news mentions and social media shares, this tab can help uncover additional context about how people are interacting with individual works.
PlumX Metrics are organized into five categories: usage, citations, captures, mentions, and social media. For more detail about PlumX categories, see the PlumX Metrics page on the Plum Analytics website.
The PlumX Snapshot displays an overview of current metrics. Each tile represents a different PlumX category and will show a summary of metrics for that category.

- For more information on each category, hover over the question mark icon to learn more.
- Click See More on a tile to see additional metrics in that category.
- Note that PlumX data will not be affected by a date range selected on the dashboard and will remain all-time.
- PlumX total downloads count other sources besides Digital Commons. As a result, the PlumX total may be higher than the Digital Commons total downloads appearing on this and other dashboard tabs.
The PlumX Metrics table breaks down the numbers in each category by individual work. The table can be sorted by work or any of the metrics. Click a PlumX category tile to focus the table on that category. The headings of the table change to reflect the specific metrics within that category.
Table view after clicking the Usage tile:

Click a title to view a pop-up with detailed metrics for that work. For even more detail, click See full PlumX record for this item on the pop-up.


To return to viewing all PlumX categories in the table, click All.

Click the Export button at any point to download current results in the table to a CSV file.
Share the Dashboard
Save & share button
The Save & Share button allows you to save a dashboard view, including any currently selected filters. This can be a view you wish to come back to or one you’d like share with others.
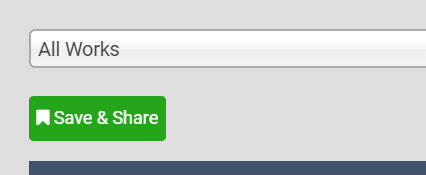
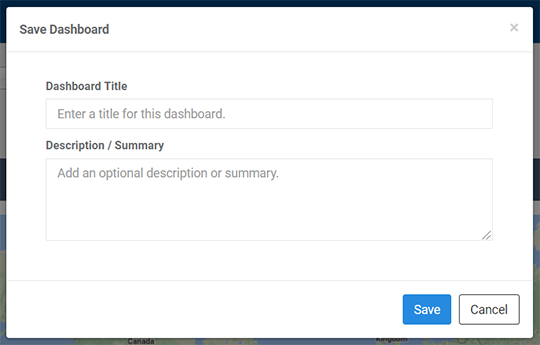
Whenever you’d like to save a dashboard view, click Save & Share. Enter a Title and Description (optional) and click Save.
Next, you’ll have the option to share a link to the saved dashboard view.
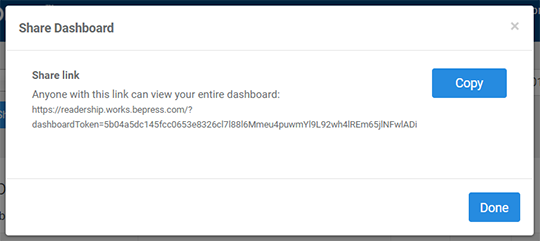
The “Copy” button changes to “Copied” when clicked and you can paste anywhere you’d like to share. A user who clicks on a share link can explore the dashboard, but they won’t be able to see your account or the Share the Dashboard tab.
You may close the window if you don’t wish to share at this time. In either case, the view will be added to your Saved Dashboards list on the Share the Dashboard tab. On that tab, you’ll find a Share button for your saved dashboards anytime you want to share. More details are available below.
Access saved dashboard views
Click the share icon to visit the Share the Dashboard tab and access the dashboard views you’ve created using the Save & Share button.

You can edit items in your Saved Dashboards list and use the Share links to demonstrate impact to stakeholders or share stories in your dashboard with others.

For each saved dashboard in the list, columns show:
- Title and description entered when saving the dashboard.
- Pencil icon for editing the title and description.
- A Share button with the same Share Link option available when using the Save & Share button (described above on this page).
- The number of visits by people with whom the dashboard is shared. Views are tracked as users click the link to visit the dashboard.
- Trash can icon for deleting the dashboard. Links to shared dashboards do not expire. However, you may delete a link at any time if you no longer wish to provide guest access to a particular view.
What guest users see when a link is shared
Sharing a dashboard generates a link to a specific initial view of the dashboard to share with stakeholders or individuals. No password is required for users who access the dashboard via share links.
A user who clicks on a share link can see the initial view plus explore the rest of the dashboard. However, they won’t be able to see your account or the Share the Dashboard tab.
If you have any questions, please contact Consulting Services.
 Digital Commons Help Center