How Can We Help?
Impact Dashboard for SelectedWorks AdministratorsImpact Dashboard for SelectedWorks Administrators
Expert Gallery Suite was retired in April 2025.
The Impact Dashboard is an interactive tool for SelectedWorks administrators to track activity and measure impact across an institution’s author profiles. Use the dashboard tabs to visually explore readership, generate detailed reports, dig into PlumX Metrics, or share your favorite dashboard views.
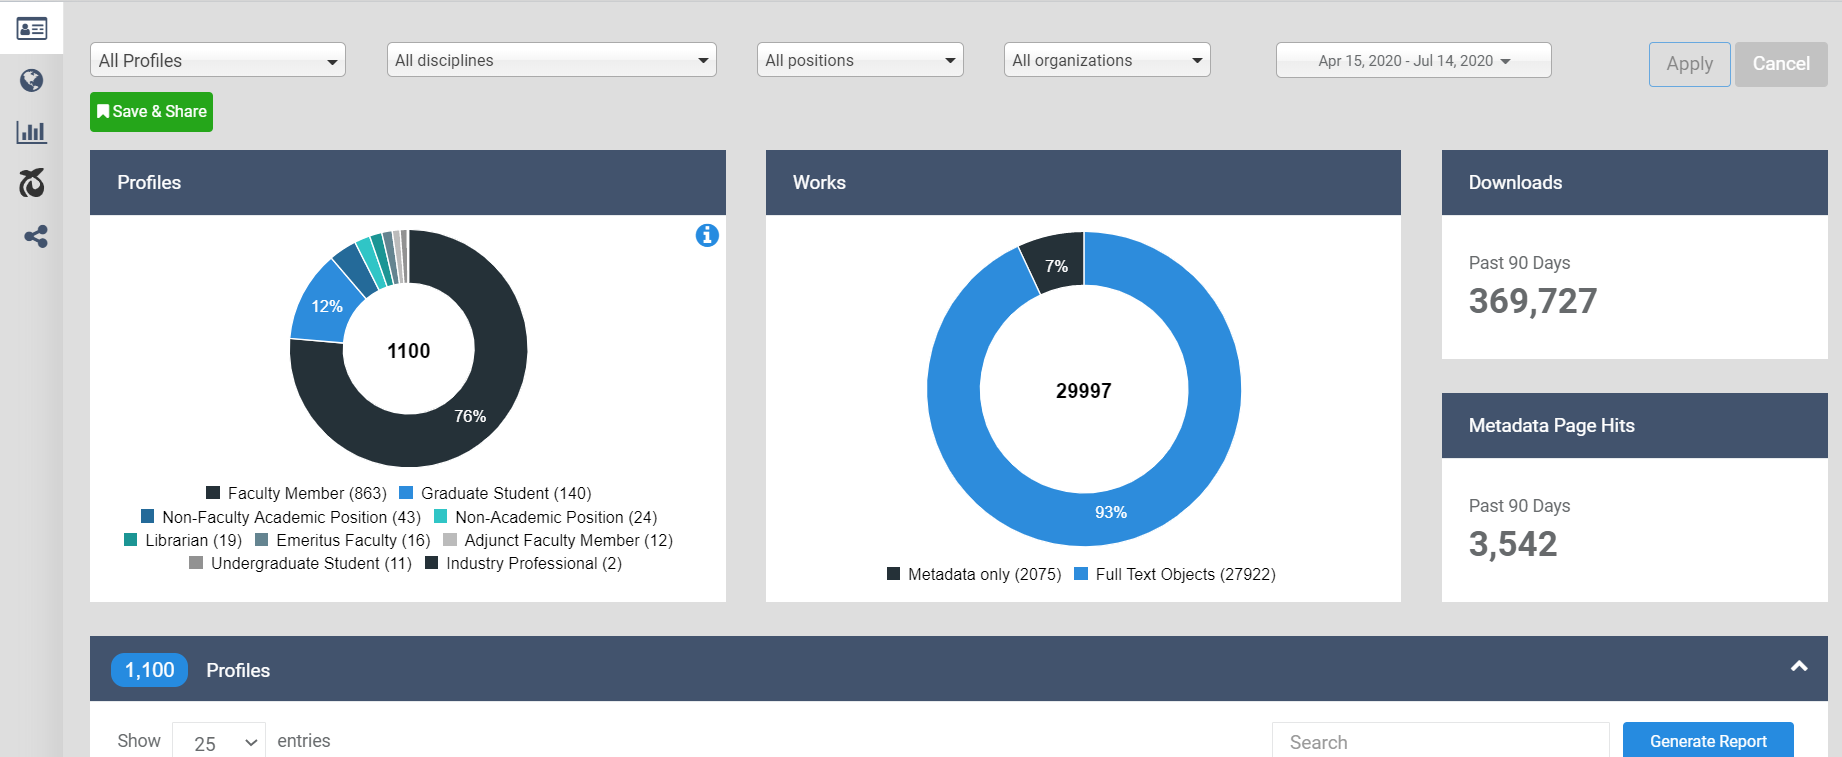
- Profiles Snapshot: Quickly see how many profiles are associated with your institution, the total number of published works, and a current tally of downloads.
- Readership: Get a comprehensive picture of where and how users are accessing content geographically, by institution, and over time.
- Usage Reports: Run reports showing downloads, metadata page hits, works posted, or individual works for the time frame selected.
- PlumX: See the full impact of each work with citations and alternative metrics from PlumX Metrics.
- Share the Dashboard: View saved dashboards and share them with stakeholders to demonstrate impact with no login required, and track the number of views.
Each tab is covered in more detail below.
Access the Impact Dashboard
As a SelectedWorks administrator, you have access to a discrete Impact Dashboard for your own use, separate from those that other administrators see. The dashboard will save your last used settings and the specific dashboard views you want to return to or share.
Access the dashboard in any of the following ways:
- Visit https://dashboard.bepress.com and log in.
- Or navigate from https://works.bepress.com using the SelectedWorks main menu in the upper right. The Reports tab in your SelectedWorks Administrative Interface provides another route.
- Or, if you are also a Digital Commons repository administrator, you can use the drop-down selector at the top of your Digital Commons Dashboard to switch to your Impact Dashboard.
The Profiles Snapshot tab is active by default when you first load the dashboard, with data shown for all works from the past 90 days. You can refine the data shown on the dashboard with multiple date and filter options, described below.
Filter Dashboard Contents
The filtering options at the top of the dashboard allow you to narrow data and usage reports by discipline, position, organization, and time frame. You may also isolate data from specific profiles.
Modify the Date Range
Select a specific date range using the menu at the top right of the dashboard. Widgets and reports adjust to reflect the dates shown, except PlumX Metrics which remain all-time.
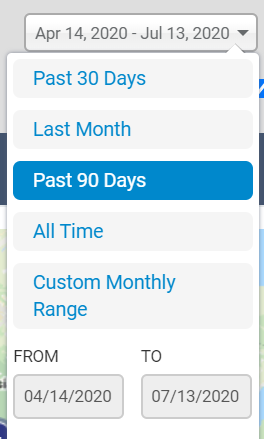
- Past 30 Days: A 30-day snapshot including today’s date.
- Last Month: The previous calendar month.
- Past 90 Days: The maximum amount of time for which daily results are returned in usage reports.
- All Time: Monthly data going back to the earliest activity on your institution’s profiles. (Note: most statistics on the Readership tab have data available starting December 2014. Applicable dates display at the bottom of each widget.)
- Custom Monthly Range: Allows you to select a custom range of available dates containing statistics for your institution’s profiles. The date range is inclusive, so to run a report on a single month, select the same month for the start date and end date.
The options for the past 30 days, past month, and past 90 days show daily counts. Anything prior to 90 days is aggregated by month.
Filter by Discipline, Position, or Organization
Use the menus at the top of the dashboard to select disciplines, positions, and organizations applicable to the currently selected content.
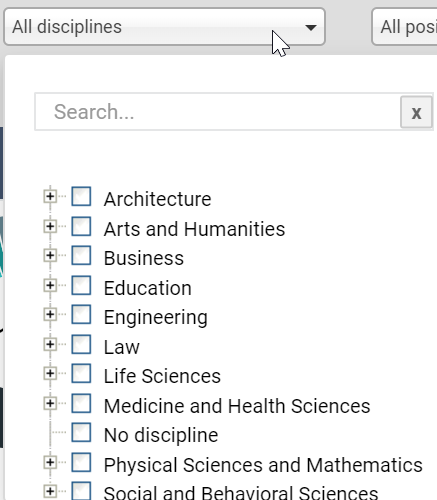
Click the Apply button to add those filters.
A label will appear at the top of the dashboard for each filter that is currently applied. To remove a filter, click the “x” next to the label.
If you select multiple values under any one heading, such as multiple disciplines, the filter performs an OR operation and will show all matching profiles (e.g., checking Biology and Literature will show all profiles that match either discipline). Combining values from different headings has an AND result. For instance, if you select Faculty Member for the position along with the Biology discipline, you’ll see data for biology faculty profiles.
View Data for a Specific Profile
Use the Profile menu at the top of the dashboard to highlight data for an individual SelectedWorks profile. Simply choose from the list or start typing in the search box to narrow the works to locate a particular author’s profile. Selecting a profile will focus the dashboard components on the statistics for that profile.
Select “All Profiles” at the top of the menu to return to viewing data for your all of your institution’s SelectedWorks content.
Statistics for individual profiles are also accessible via the Profiles table on the Profiles Snapshot tab.
Save & Share Button
As you explore the Dashboard, you can easily save views that you’ll want to revisit. Use the Save & Share button to capture a dashboard for your own use or to share with others.
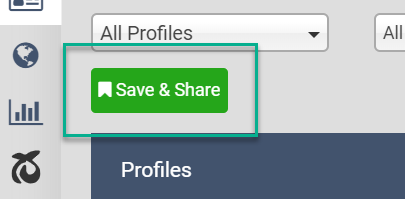
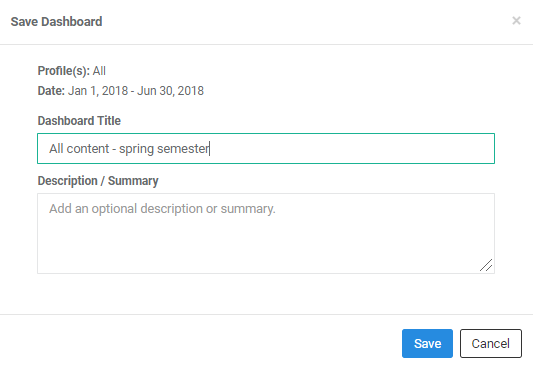
Whenever you’d like to save a dashboard with the currently selected filters, click Save & Share. Then, review the parameters, enter a Title and Description (optional) for the saved dashboard, and click Save.
Next, you’ll see three options: Share link, Send by email, and Schedule.
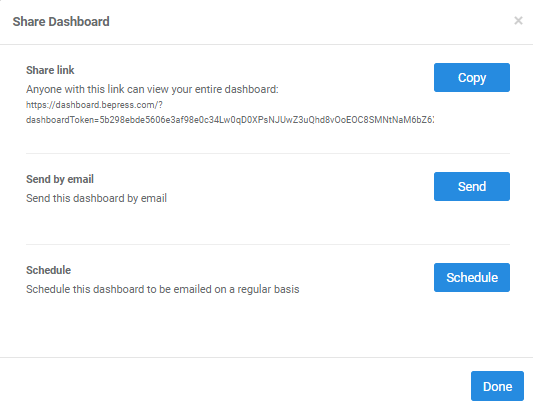
Here are the actions that occur when selecting each option:
- Share link: The “Copy” button changes to “Copied” when clicked and you can paste anywhere you’d like to share.
- Send by email: Displays a field for entering recipient(s) email addresses. Separate multiple emails with commas. Select the CC option if you want to have a copy sent to yourself (at your bepress account email). The Preview button allows you to view what the email will look like, with placeholder text shown for variable fields.
- Schedule: Displays options for scheduling email delivery on a future date or on a recurring basis. You may select a frequency of weeks, months, or years. As with “Send by email” above, you can CC yourself if desired and use the Preview button to see what the email will look like.
Whether you choose a share option or close the window, the view will be added to your Saved Dashboards list on the Share the Dashboard tab. On that tab, you can use the Share button for any of your saved dashboards to access the same options as above for sharing. See more details below in the “Share the Dashboard” section.
Profiles Snapshot
The Profiles Snapshot is the landing page for the dashboard and gives a quick overview of activity and metrics for your institution’s SelectedWorks.
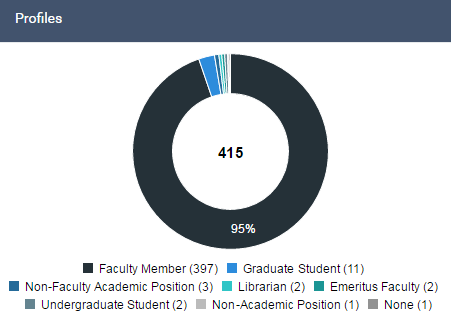
Profiles Chart
The total number of SelectedWorks profiles matching your criteria appears in the center of the Profiles chart. The outer ring sections break down the numbers by position type, with a percentage and total shown for each.
Works Chart
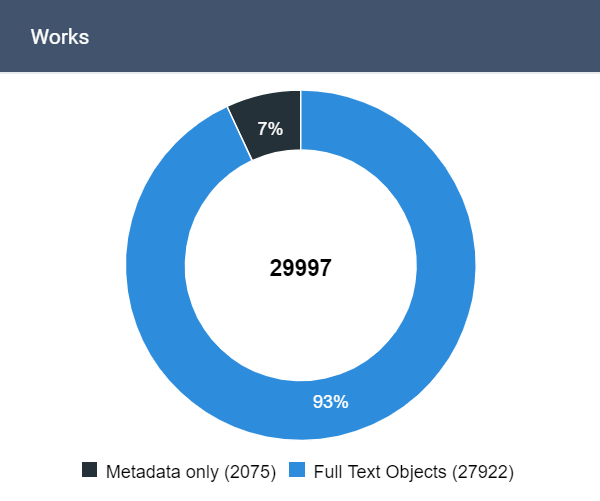
The total number of matching works appears in the center of the works chart. These are broken down by full text and metadata-only works in the outer ring sections. If a work was imported from Digital Commons and the full text resides in the repository, it is counted here as a full text article. If a work from Digital Commons has been imported into multiple author profiles, it is counted as just one work in the dashboard.
Downloads and Metadata Page Hits
View the Downloads chart to see counts for full texts that live on SelectedWorks as well as full texts that reside in Digital Commons for items imported to SW. The accompanying chart shows metadata page hits in SelectedWorks.
Profiles Table and Reports
This is a list of all profiles, similar to the drop-down menu at the top of the dashboard. The table includes a link to each profile (![]() ) as well as author positions and organizations, total works, metadata hits, and downloads. Profiles are sorted by total downloads within the selected date range.
) as well as author positions and organizations, total works, metadata hits, and downloads. Profiles are sorted by total downloads within the selected date range.

Multiple positions and organizations will appear if applicable for a given author, with the current entry listed first followed by past entries.
Click the Generate Report button to download profile-specific information to an Excel spreadsheet. In addition to the contents of the table, the report contains the date created for each profile, the profile URL, author email, total full text and metadata articles, and submissions posted in the time period.
Click an author name to filter the dashboard by that profile. This action automatically takes you to the top of the Readership tab for that profile.
Readership Tab
The components on the Readership tab will each adjust to match the dashboard’s current scope and date range.
Readership Distribution Map
This geographic visualization shows the sources of your institution’s SelectedWorks readership on an interactive world map. Click the numbers in the download clusters or use the +/- zoom buttons for a more granular view. When fully zoomed in, clicking the lowest-level marker provides a detailed list of downloads by institutions in that area, if applicable.
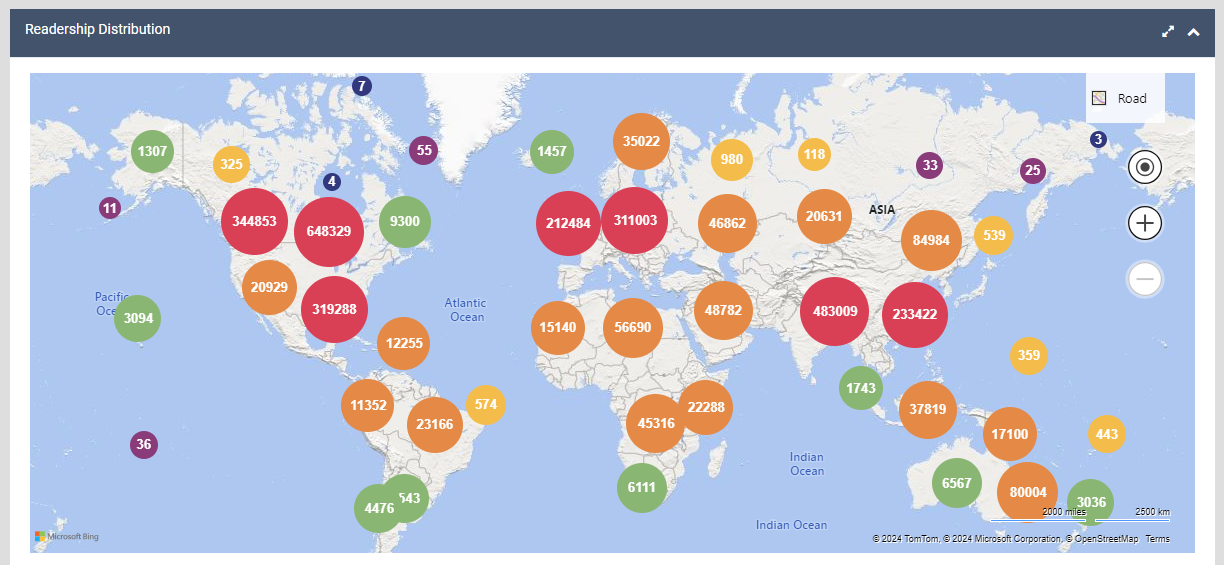
Move the map by dragging it. Click the view larger icon ( ) to expand the size of the map, which can be particularly useful on a mobile device.
Institutions
The Institutions table displays academic institutions, organizations, businesses, and government agencies where full texts were downloaded, based on IP address. Each institution is listed with its total downloads.
Start typing in the table’s search box to find a particular institution or institution type, and use the arrow to the left of an institution to view individual article downloads for that location. If you see an institution in an incorrect category, tell us about it! Click the note icon next to the institution type for an expanded institution and complete the form.

At any point, click Export to download the currently visible data to a CSV file.
The percentage of downloads per institution type appears in the color-coded graph at the top. Click an institution type or color block to filter the list by type, or select from the Filter by type menu.

To return to viewing all institution types, select “Show All” from the menu.
Country/Region
This table shows top downloads by country, which are easily broken down by region or state using the interactive map. Click a country on the map to see a regional or state distribution of that country’s readership and to populate the table with the regions displayed.
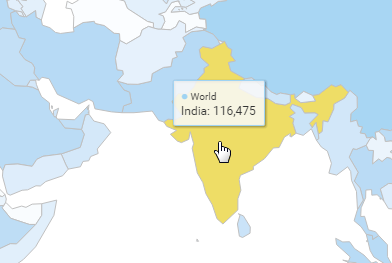
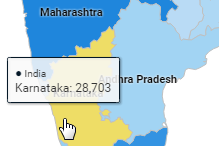
Hovering over a region on the map provides a quick view of the associated downloads. To return to the world map, click the “Back to World” button.
Start typing in the search box to find locations in the table. Expand an entry to see which articles were downloaded in that country or region. Click Export to download currently visible data to a CSV file.
Referrers
The sites listed here reveal the sources of inbound traffic to full texts. Search for referrers and export current results to a CSV file. Note that some valid downloads do not have associated referral data, because not all users pass along referral information. Over the years, fewer and fewer browsers and search engines have passed along this information, so referrer numbers now include only a small fraction of total traffic.
Usage Reports Tab
Find a visual snapshot of downloads and metadata page hits on the Usage Reports tab, and easily generate reports to capture that data. You also have access to statistics for individual works and a tally of works posted during the selected time period.
Downloads
Use the Downloads graph to view full-text downloads for the currently selected date range. You may also generate a report to store or manipulate the data in a spreadsheet.
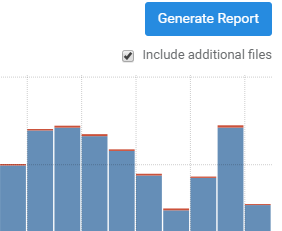
Click the Include additional files box if you wish to count supplemental files, which may be present from imported Digital Commons articles or carried over from the previous version of SelectedWorks. Additional file downloads will display in red at the top of the graph bars.
To retrieve a download report for the active date range and filters, click the Generate Report button. Report options:
- Provide: Choose “Summary by profile” if you wish to view download totals for each SelectedWorks profile at your institution. “Details for all works” returns download counts for each individual work. For works imported from Digital Commons, the URL field in the report will show the URL on Digital Commons where the full text lives, and the status field will reflect the status of that full text document. The “Imported to” field will include the URL for the SelectedWorks page that links out to that full text. The Provide option does not appear when running a report for a single profile; details for all works are automatically included.
- Aggregate By: Select “Total” to view all matching downloads for each profile or record (depending on your choice above). You may also break the numbers down by year, month, or day. Choosing “Year” or “Month” will organize numbers into separate columns for each calendar year or month included in the date range. “Day” is only an option for reports generated for the last 90 days or less.
Click the Email me the report button when finished selecting options. You’ll receive an email containing a link to download the report in an Excel spreadsheet.
Metadata Page Hits
This graph shows how often visitors landed on article metadata pages in SelectedWorks during the active time frame. Report options are as follows:
- Provide: Choose “Summary by profile” if you wish to view hit totals for each SelectedWorks profile at your institution. “Details for all works” returns hits for each individual work. When running a report for a single profile, the Provide option does not appear and details for all works are automatically included.
- Aggregate By: Returns either a total number of hits for each record, or breaks the numbers down by year, month, or day based on the option selected. If “Year” or “Month” are chosen, numbers are organized into separate columns for each calendar year or month included in the date range. The “Day” option only appears for reports generated for the last 90 days or less.
Click the Email me the report button when finished selecting options. You’ll receive an email containing a link to download the report in an Excel spreadsheet.
Downloads tend to be higher than metadata page hits, since users frequently access full texts directly via search engines. Metadata page hits can offer insights into how readers interact with your institution’s SelectedWorks by browsing and searching profiles, typing a URL from a citation, or clicking metadata page links in search results.
Works Posted
The Works Posted graph counts full texts and metadata-only works posted to profiles within the selected date range. Search to refine the results and click Export to generate a CSV file with the currently visible results. Works posted include both works directly published to SelectedWorks and works imported from Digital Commons.
Works
The Works list shows downloads for works on all matching profiles. Search for a particular work, or browse titles using the Next and Previous buttons. Then click the title of a work to focus the dashboard components on that article.
Click the icon (![]() ) to the left of an article title to view the posted submission on the respective profile. If a work was imported from Digital Commons into multiple author profiles, you will be given the option to choose which profile to visit. The work is counted only once in the dashboard, and all versions in SelectedWorks will have identical download counts due to the single file.
) to the left of an article title to view the posted submission on the respective profile. If a work was imported from Digital Commons into multiple author profiles, you will be given the option to choose which profile to visit. The work is counted only once in the dashboard, and all versions in SelectedWorks will have identical download counts due to the single file.
Associated metadata page hits will vary depending on each profile’s traffic. For works with duplicates, you will have the option when clicking the work’s title to choose which version to explore on the dashboard.
Click Export at any point to download current results in the table to a CSV file.
PlumX Metrics
The PlumX tab provides citations and altmetrics for measuring the broader impact of items on a profile. With access to diverse metrics, such as news mentions and social media shares, this tab can help uncover additional context for you and your stakeholders about how people are interacting with works.
PlumX Metrics are organized into five categories: usage, citations, captures, mentions, and social media. For more detail about PlumX categories, see the PlumX Metrics page on the Plum Analytics website.
The PlumX Snapshot includes a summary of current metrics for each PlumX category.

- For more information on each category, hover over the question mark icon to learn more.
- Click See More on a tile to see additional metrics in that category.
- Note that PlumX data will not be affected by a date range selected on the dashboard and will remain all-time.
- PlumX total downloads include other sources besides Digital Commons and SelectedWorks, so the PlumX download count total may be higher than the sum of DC and SW download counts.
The PlumX Metrics table breaks shows the same numbers as shown the tiles, listed by individual work.

Click a PlumX category tile to focus the table below on that category. The headings of the table change to reflect the specific metrics within that category. Table view after clicking the Usage tile:

Click a title to view a pop-up with detailed metrics for that work. For even more detail, click See full PlumX record for this item on the pop-up.


To return to viewing all PlumX categories in the table, click All.

Click Export at any point to download current results in the table to a CSV file.
Share the Dashboard
Visit the Share the Dashboard tab to see the views you’ve created using the Save & Share button, described above on this page. You can edit saved dashboards and use your preferred share method to demonstrate impact to stakeholders or share stories in your dashboard with others.

For each saved dashboard in the list, columns show:
- Title and description entered when saving the dashboard.
- Pencil icon for editing the title and description.
- Frequency and next send of any scheduled shares.
- A Share button with the same three options that are available via the Save & Share button. Use this button to copy the share link, send a link by email, or modify the scheduled share date or frequency.
- The number of visits by people with whom the dashboard is shared. Views are tracked as users click the dashboard link.
- Trash can icon for deleting the dashboard. Links to shared dashboards do not expire. However, you may delete a link at any time if you no longer wish to provide guest access to a particular view.
What guest users see when a link is shared
Sharing a dashboard generates a link to a specific initial view of the dashboard to share with stakeholders or individuals. No password is required for users who access the dashboard via share links.
A user who clicks on a share link can see the initial view plus explore the rest of the dashboard. However, they won’t be able to see your administrative tools or the Share the Dashboard tab. Guests also do not have the ability to generate reports, though the Export options are available to them.
Those viewing the Impact Dashboard via a share link are not able to access other dashboards an administrator may have access to, such as the Digital Commons Dashboard for repository administrators.
Common Questions
What constitutes a download?
See our page on Accurate Metrics for a detailed answer about how bepress defines a download. Please note that a set amount of time needs to pass between downloads of an item from the same IP address for them to not count as duplicates. Downloads by administrators from the administrator-facing side of our system are not counted. We also filter out all downloads made by bepress.
Do usage statistics include withdrawn items?
Withdrawn items are included on the dashboard and in usage reports, along with any previous download data available for them. In usage reports, they are identified as withdrawn in the “Status” column.
Do usage reports support Chinese or Unicode characters?
Yes. Submission titles with Chinese or other Unicode characters will display properly in usage reports.
If you have any questions, please contact Consulting Services.
 Digital Commons Help Center